Hallo,
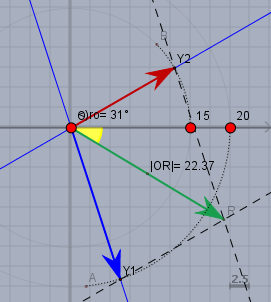
wenn Du für beide Schwingungen den Cosinus verwenden willst, so nutze den Zusammenhang$$\sin(x) = \cos\left( x - \frac \pi2\right)$$Also ist \(y_1\)$$y_1(t) = 20\,\text{cm}\cdot \sin\left(\omega t+ \frac \pi{10}\right)\\ \phantom{y_1(t) }= 20\,\text{cm}\cdot \cos\left(\omega t - \frac{2\pi}{5}\right)$$Mache Dir dann ein Zeigerdiagramm, genauso wie von lul vorgeschlagen:

da kann man das Ergebnis schon 'rausmessen'. Zur Berechnung bestimme die Koordinaten der Zeiger und addiere sie:$$a = 20 \cdot \cos\left( - \frac{2\pi}{5}\right) + 15 \cdot \cos\left(\frac{2\pi}{3}\right) \approx 19,17 \\ b = 20 \cdot \sin\left( - \frac{2\pi}{5}\right) + 15 \cdot \sin\left(\frac{2\pi}{3}\right) \approx -11,62$$Und die Resultierende ist dann$$y_1(t) + y_2(t) = \sqrt{a^2+b^2} \cdot \cos\left( \omega t + \arctan\left(\frac ba\right) \right) \\ \phantom{y_1(t) + y_2(t) } \approx 22,4\,\text{cm} \cdot \cos(\omega t - 0,54) $$Hinweis: beim \(\arctan\) immer aufpassen, in welchem Quadranten man sich befindet! Anbei die beiden Graphen im Plotlux
~plot~ 20*sin(x+pi/10)+15*sin(x+2*pi/3);[[-7|7|-25|25]];22.4*sin(x+1.03) ~plot~
wie man sieht, überlappen sie erwartungsgemäß.
Gruß Werner
PS.: ein bißchen mehr Feedback - in wie weit die Antwort hilfreich war - würde mich freuen.